Power BI to Excel: How to Use OLAP Connections for Always-Up-to-Date Reports
Learn how to connect Power BI to Excel using OLAP tables for always-up-to-date reports. Save time, avoid manual exports, and empower management with live data.

Have you ever spent hours building a stunning Power BI dashboard, only to have management ask at the end of the meeting, “Can you send me the Excel file?”
I’ve been there, and it can feel frustrating to repeatedly export data just to meet this request.

The good news? You don’t have to. With Excel OLAP connections to Power BI’s semantic model, management can pull the latest data directly into Excel, refresh it with one click, and explore the numbers themselves, all without asking you for another export.
In this article, I’ll walk you through why this approach works, how I set it up, and the best practices I’ve learned from using it with real-world management teams.
Why Connect Power BI to Excel Instead of Exporting?
Exporting dashboards into Excel every time management asks has two big downsides:
- It’s manual and repetitive. You waste valuable time extracting, cleaning, and sending files.
- Data gets outdated fast. By the time leadership reviews the file, it might already be old.
Using Excel’s OLAP feature flips the script:
- Data flows directly from the Power BI Service’s semantic model into Excel.
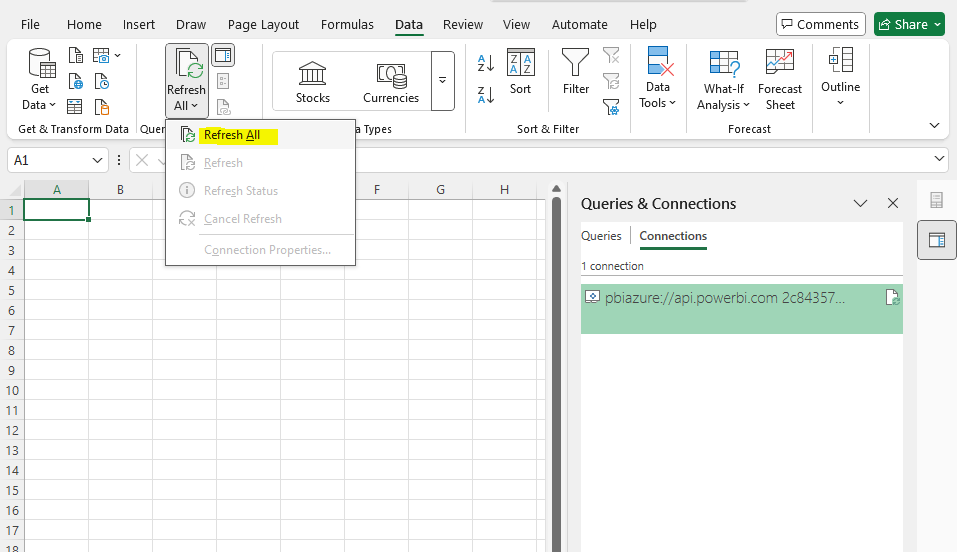
- Anyone with access just needs to hit refresh before use.
- The report always shows the most current numbers without extra work from you.
This setup empowers management to self-serve their analysis while you stay focused on building better dashboards.
How to Connect Excel to Power BI Semantic Models
Using these two (2) methods, Excel is no longer just a static export; it’s a live reporting tool synced with your Power BI dataset.
Option 1: Direct from Microsoft Fabric
This is the simplest way to connect without any customizations as the whole Semantic model is connected to the Excel File as a Pivot table.
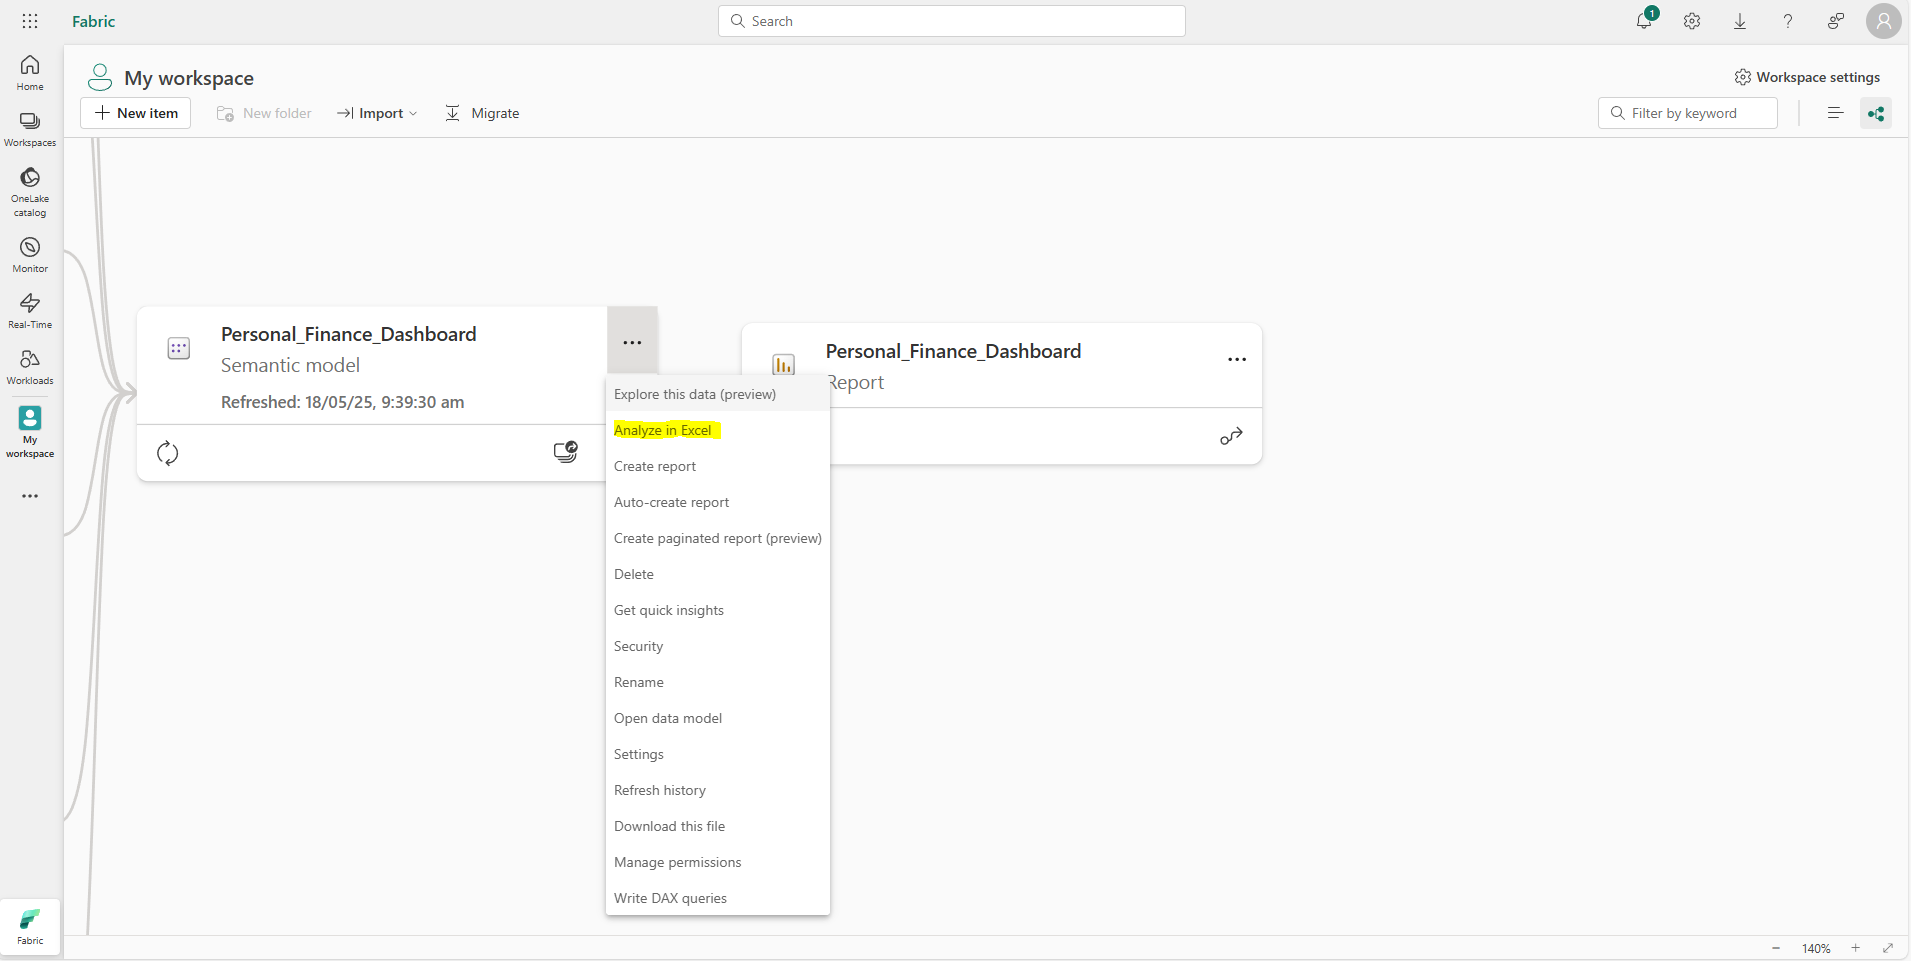
- Open Microsoft Fabric and go to your specific Workspace.
- Select your Semantic Model > ellipses > Analyze in Excel.
- An Excel File is downloaded for you to use straightaway as a PivotTable.
Option 2: Load Semantic Models from Power BI
For this option, you will need a Power BI Pro license or higher (which you probably have if you are using Power BI in your organization)
This is my recommended way of loading your Semantic Models, as you would have more options in customizing which data you want to include in the Excel file. Extremely advantageous if you have a large dataset, but Management only needs specific portions, i.e., current year data.
Here’s a simple workflow I use:
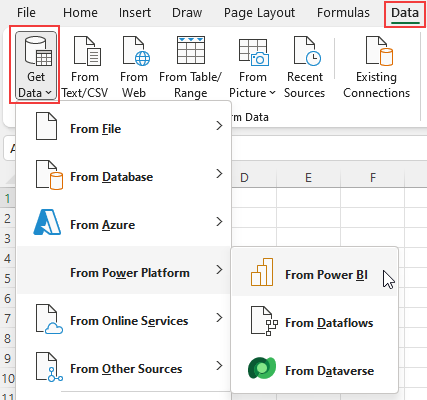
- Open Excel and go to the Data tab.
- Select Get Data > From Power Platform > From Power BI.
- Choose the dataset you want to connect.
- Load it as a PivotTable or directly as a connected table.
Best Practices I’ve Learned
Through trial and error, I’ve found a few habits that make this setup smoother for management teams:
1. Minimize Tables in the Data Model
- Merge or simplify tables where possible.
- Flat tables work best because management often wants quick answers rather than complex data relationships.
2. Filter Large Datasets
If your dataset is heavy, I usually limit the view to the current year. Most executives only need to see this year’s performance anyway.
3. Load One Table, Build Multiple Pivots
Instead of connecting multiple PivotTables directly to Power BI (which slows Excel down), I:
- Connect a single wide table with all needed columns.
- Then build PivotTables on top of that one table.
This approach dramatically improves performance and reduces refresh time.
My Verdict: Is It Worth Doing?
Absolutely. If your organization uses Power BI but your leadership still loves Excel, this is the perfect bridge. Like any workflow, this approach has strengths and trade-offs:
Pros:
- ✅ Always up to date, no more outdated exports.
- ✅ Saves you time and manual effort.
- ✅ Gives management more autonomy.
- ✅ Excel features (PivotTables, charts) remain fully available.
Cons:
- ❌Requires access to the Power BI Service.
- ❌Large models may slow down refresh performance.
- ❌Some executives may still prefer pre-packaged reports over self-service.
I strongly urge everyone to try using OLAP connections from Power BI to Excel. It’s a win-win for both management and you: faster reporting for them, less manual work for you.
You can even use it to look at live SQL database data. More on that on the guide below.
Related Article: