Mastering Excel: From Beginner Spreadsheets to Advanced Data Analytics
Microsoft Excel is one of the MOST powerful tools in the corporate world. In this guide, we’ll break down the three levels of Excel mastery, from beginner to advanced, along with examples of projects you can try at each stage.

Microsoft Excel is one of the MOST powerful tools in the corporate world. Whether you’re tracking expenses, analyzing financial data, or building interactive dashboards, there's so much you can do.
In this guide, we’ll break down the three levels of Excel mastery, from beginner to advanced, along with examples of projects you can try at each stage.
Level 1: Excel as a Spreadsheet
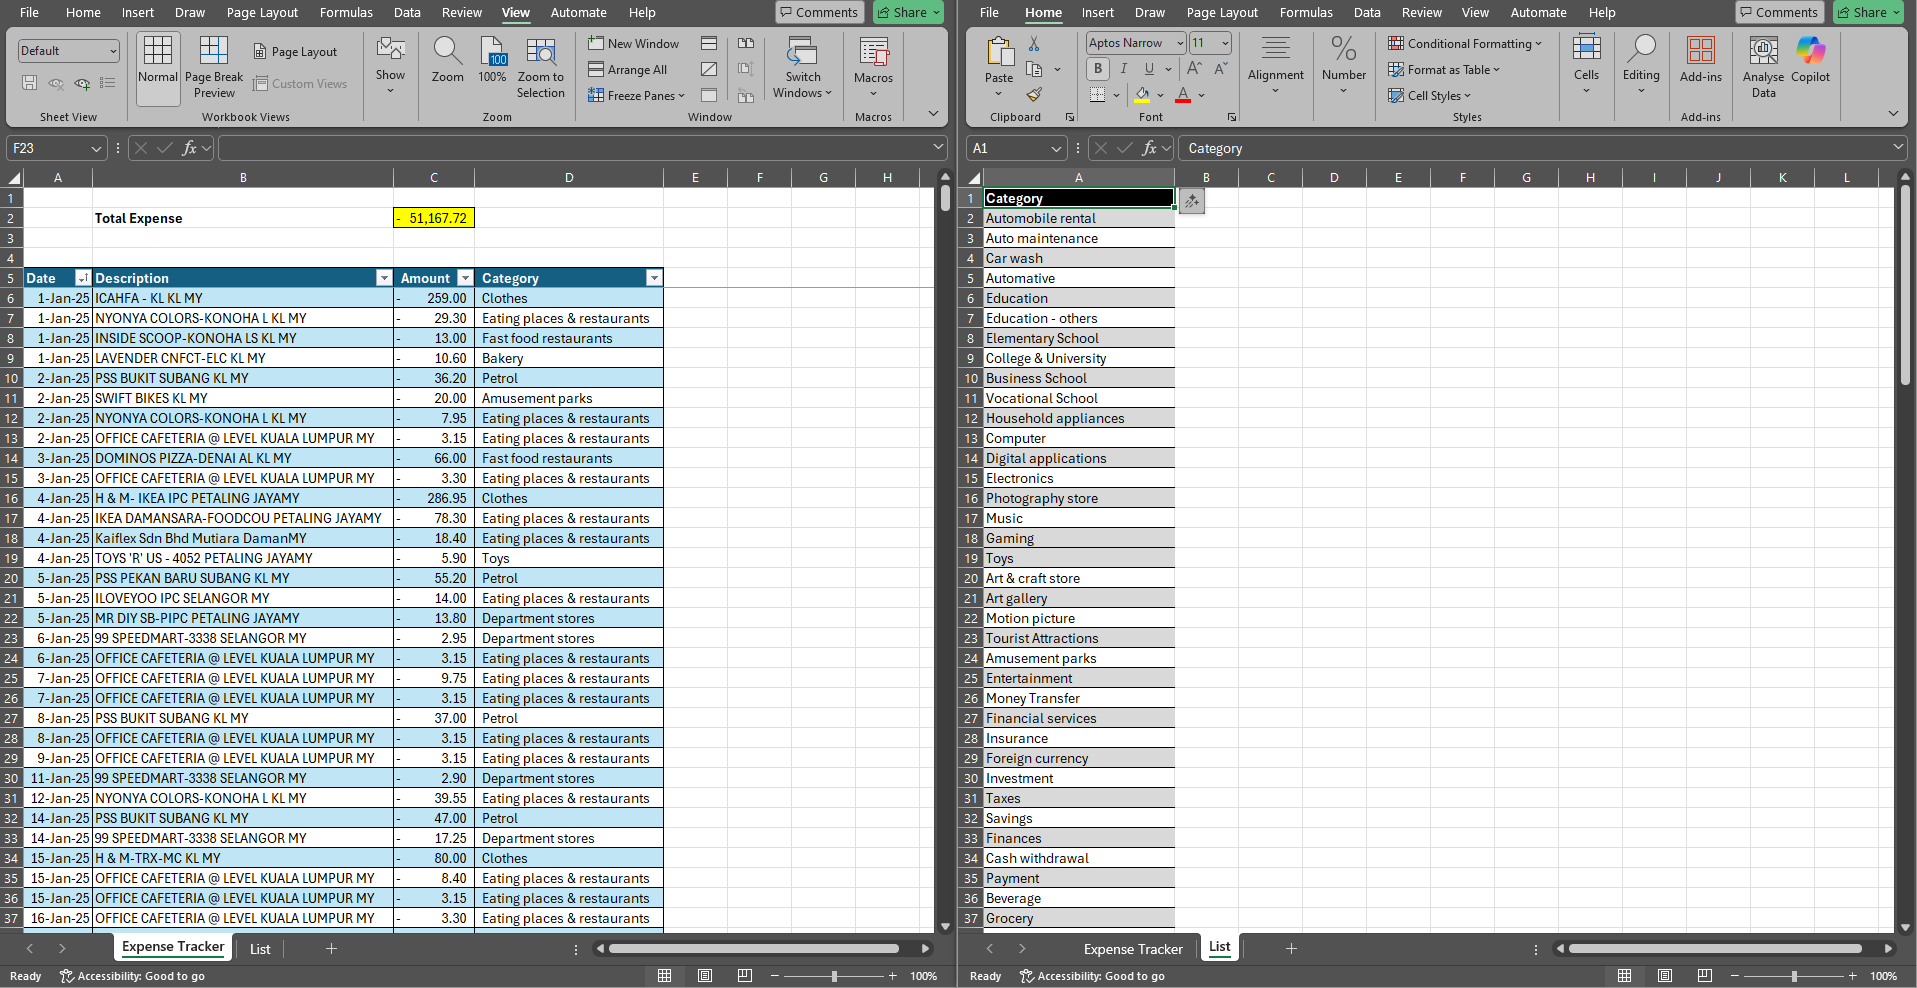
At the beginner stage, Excel is primarily used as a digital spreadsheet to organize information. Users enter numbers, text, or dates into rows and columns, making it ideal for simple data logging and calculations.
I'd say you would typically start at this level in your first job after graduation.
What You Can Do at Level 1
- Expense Tracker: Create a basic table where you log daily or monthly expenses, add categories (food, bills, entertainment), and calculate totals with the SUM function.
- To-Do List: Track tasks, deadlines, and completion status using checkboxes or simple conditional formatting.
- Basic Inventory List: Record product names, quantities, and prices for small projects or personal collections.
💡 Tip for Beginners: Learn how to use simple functions like SUM, AVERAGE, MIN, and MAX. These small steps will save you hours in the long run.
Level 2: Excel with Formulas and VBA
Once you’ve mastered the basics, you can elevate your Excel skills by using formulas and Visual Basic for Applications ("VBA") for automation. This stage unlocks Excel as a true data analysis tool rather than just a digital table.
Personally, I chose to skip learning VBA and focused directly on mastering Power Query (as outlined in level 3 below). But the more complex formulas help a lot!
Key Skills at Level 2
- Using functions like IF, VLOOKUP/XLOOKUP, INDEX-MATCH, and TEXT formulas
- Automating repetitive tasks with VBA macros
- Applying conditional formatting for insights at a glance
What You Can Do at Level 2
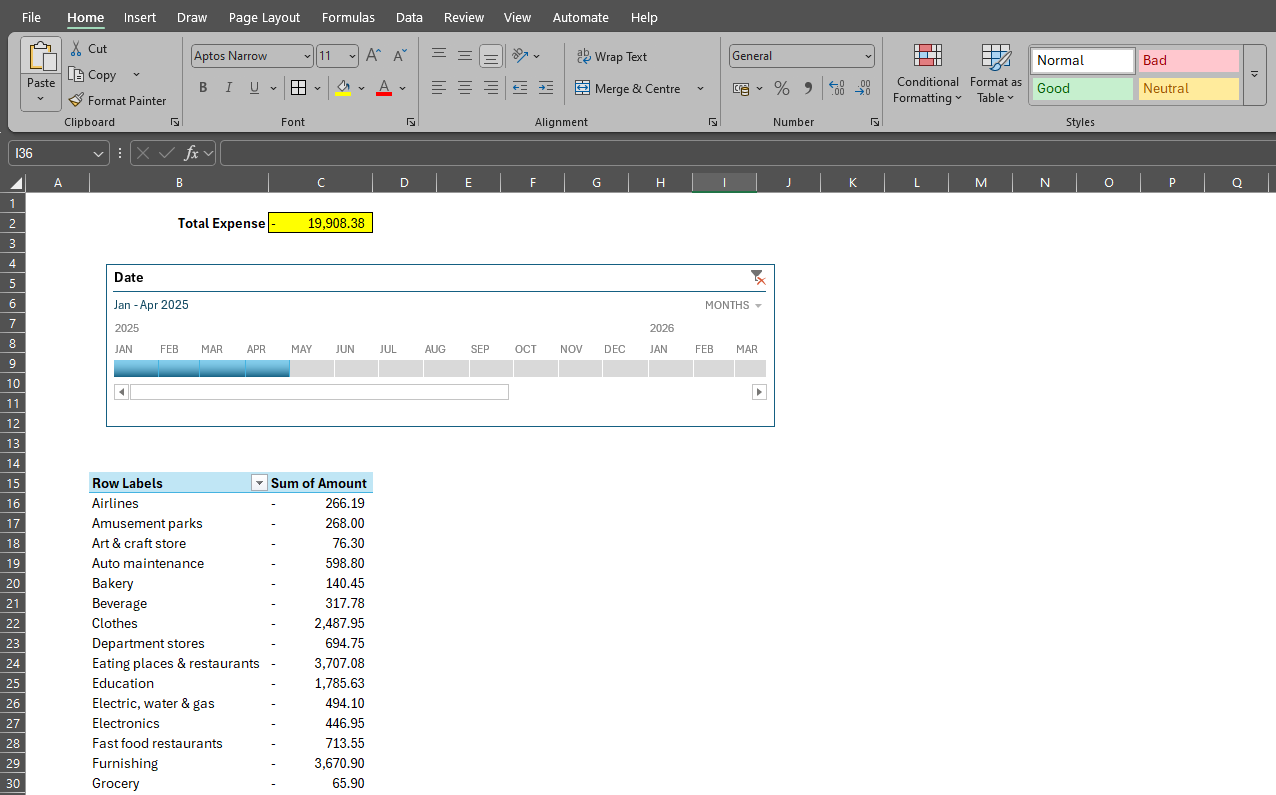
- Personal Finance Tracker: Move beyond expenses and build a full financial model inside Excel. You can track income, savings, debts, and even generate monthly summaries with formulas.
- Grade Calculator: Automate weighted averages for academic results.
- Project Task Tracker: Use formulas to monitor deadlines, flag overdue tasks, and highlight high-priority work.
💡 Tip for Intermediate Users: Start exploring PivotTables to summarize large sets of data without writing formulas.
Level 3: Excel with Power Query and Data Integration
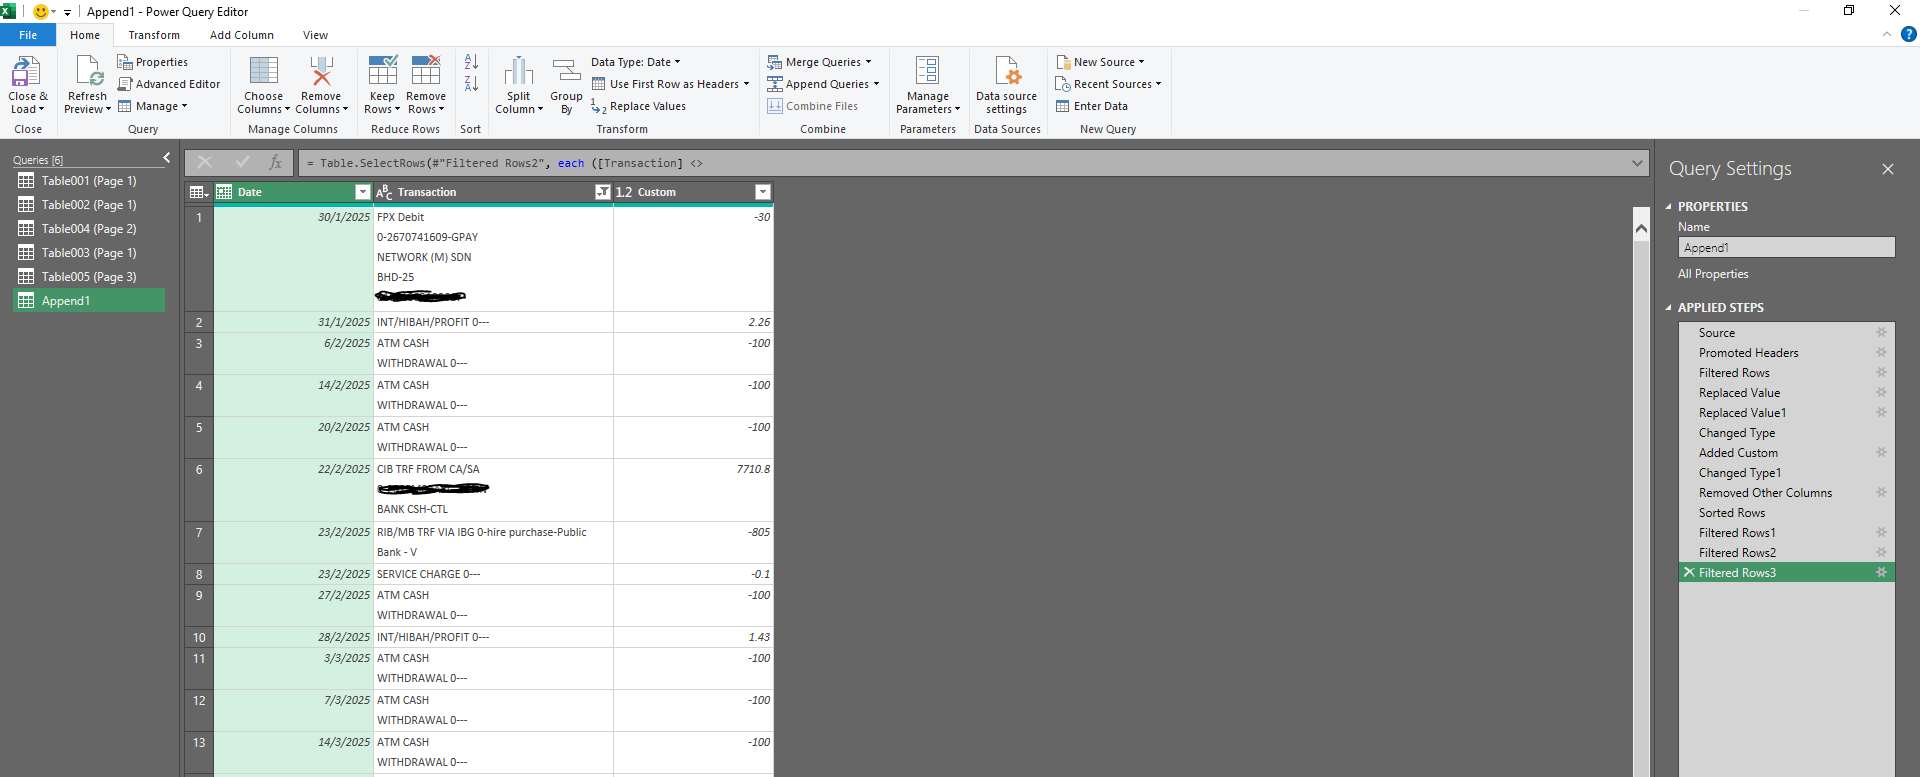
The real power of Excel emerges at Level 3. Here, you’ll use Power Query to import and transform data from multiple sources; i.e., databases, web pages, CSV files, or even Application Programming Interface ("API")s. Power Query also removes the traditional Excel row limit, allowing you to handle massive datasets.
At this stage, you’re no longer limited to what Excel alone can do. It becomes a gateway to advanced data analytics, allowing you to integrate your knowledge of SQL or Python for even deeper insights.
Power Query is also an integral tool for Power BI. As you have started learning Power Query, you have already begun learning Power BI too!
Key Skills at Level 3
- Connecting Excel to databases, websites, and cloud services
- Cleaning and transforming data automatically with Power Query
- Building advanced dashboards with slicers, charts, and Power Pivot
- Using DAX formulas in Power Pivot for powerful calculations
What You Can Do at Level 3
- Personal Finance Dashboard: Go beyond static spreadsheets by connecting Excel to your bank’s exported statements, investment reports, or budgeting apps. With Power Query, you can combine multiple files into one live dashboard.
- Sales Performance Dashboard: Integrate sales data from CRM systems or e-commerce exports to track KPIs across regions and products.
- Data-Driven Reports: Automate weekly or monthly reporting by pulling fresh data from multiple sources in a single click.
💡 Tip for Advanced Users: Once comfortable with Power Query, start exploring SQL for querying databases or Python for automation and analytics. These skills pair naturally with advanced Excel work.
How to Progress Through the Levels
- From Level 1 to 2: Practice formulas daily. Rebuild your simple expense tracker with automated summaries and charts.
- From Level 2 to 3: Learn how to use Power Query to connect and clean data. Experiment with combining multiple Excel files into one consolidated report.
- Beyond Level 3: Invest time in SQL and Python to prepare for large-scale data analysis and career growth in analytics.
Beyond these three levels, to go even further is on Vibe Coding. It's the use of AI to automate most of the code writing and initial analysis of data. This way, you can focus on the hard parts that really matter.
Final Thoughts
Learning Excel is a journey, starting with simple spreadsheets and growing into advanced data analysis.
- At Level 1, you take control of your personal data.
- At Level 2, you begin automating processes and building smarter trackers.
- By Level 3, you unlock Excel’s true power through Power Query, integrations, and dynamic dashboards.
I strongly encourage every aspiring data analyst to sharpen their Excel skills. Mastering Excel isn’t just about formulas; it’s about unlocking a new way of thinking, solving problems faster, and driving real impact with data.
It’s one of the most valuable investments you can make in your career, and I can confidently vouch for the transformation it brings.